
Fault Tree Analysis (FTA) is a top-down analysis that starts from an undesired event, such as an undetected cell overvoltage, and works back through AND/OR logic to the combinations of failures that could cause it. It complements the bottom-up FMEA and is used in functional safety work to calculate failure probabilities. This page is the companion to our FMEA page: what a fault tree is, how to draw one, and a worked sketch for the overvoltage case every BMS team has to close out.
What a fault tree is, and isn’t
An FMEA asks “if this part fails this way, what happens?” and walks forward. A fault tree turns the question round: we name one outcome we never want, then keep asking “what would have to be true for this to happen?” until we reach events we can put a failure rate on. The method is codified in IEC 61025 [1], and the two classic references, the NRC Fault Tree Handbook (NUREG-0492) and NASA’s update of it, are both free to download [2][3].
The important limitation is built into the method: a fault tree only contains the faults that lead to its own top event [3]. It is not an inventory of everything that can go wrong in a pack. That is the FMEA’s job. So the two are used as a pair: the FMEA sweeps for failure modes nobody had thought about, and the fault tree shows how a handful of them combine to defeat a specific safety goal.
The building blocks
A usable tree needs only five symbols. IEC 61025 and the handbooks define more (house events, transfer triangles, priority-AND and so on), but most battery work never needs them.
| Symbol | Name | What it means in a battery tree |
|---|---|---|
| Rectangle | Top or intermediate event | A fault state that still needs breaking down, e.g. “BMS fails to detect the overvoltage” |
| Circle | Basic event | The bottom of a branch: a component failure we can give a rate to, e.g. an AFE reference drifting |
| Diamond | Undeveloped event | Something we choose not to break down further, often because it sits outside our scope (an off-board charger) |
| AND gate | All inputs needed | Where redundancy lives: two independent channels must both fail |
| OR gate | Any input is enough | Where single points of failure live |
Worked sketch: undetected cell overvoltage
Overcharge is near the top of every BMS HARA. The safety goal that comes out of it is a vehicle-level requirement, something like “avoid a battery thermal event caused by overcharge”. Through the functional and technical safety concepts that goal is broken down until it reaches the BMS as a technical safety requirement, such as “prevent any cell exceeding its maximum voltage”. Our tree sits at that BMS level: one series cell in an EV pack during charge or regen. It is illustrative, not a real product, but the structure is one most packs share.
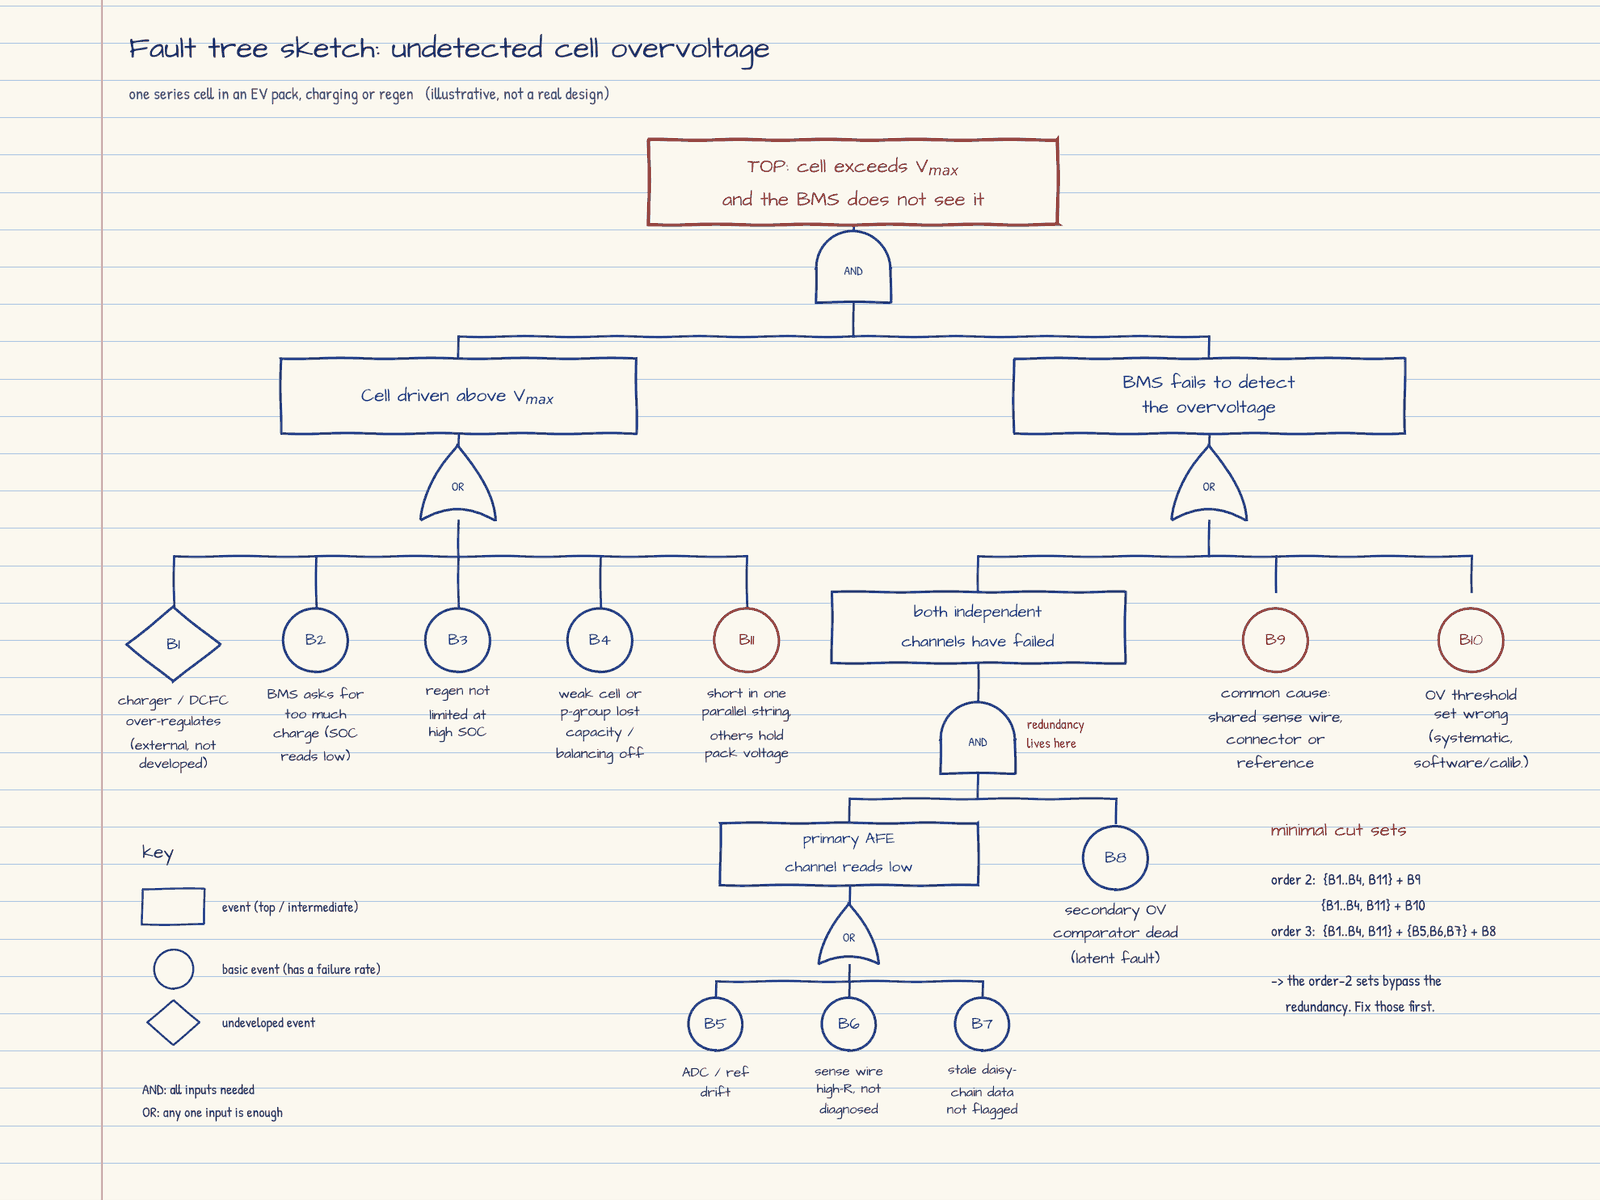
Choose the top event carefully. We wrote “cell exceeds Vmax and the BMS does not see it”, which is why the first gate is an AND: something has to push the cell over, and the detection has to miss it. If we had written “uncontrolled overvoltage” instead, the tree would also need a reaction branch (a welded contactor, a charger that ignores the stop request). Same physics, different tree. Most arguments in a fault tree review come from a top event that two people read two ways.
Left branch: what pushes the cell over. An OR of five causes. The off-board charger over-regulating is drawn as an undeveloped diamond because it belongs to someone else’s analysis. Three more are ours: a BMS charge request that is too high because the SOC estimate reads low (the drift case in our BMS/System FMEA worked example), regen that is not limited near full charge, and a weak or unbalanced cell in the string reaching Vmax before its neighbours. The fifth, B11, comes from parallel strings and is covered in the note on parallelism below.
Right branch: why the BMS misses it. This is where the design lives. A primary measurement channel through the analogue front end (AFE), backed by an independent hardware overvoltage comparator, puts an AND gate under the redundant pair. But the OR above that AND also carries two events that go straight past the redundancy: a common cause that blinds both channels at once (a shared sense wire, connector, voltage reference, supply rail or communication link), and an overvoltage threshold that is simply set wrong. The second is a systematic fault, so it has no meaningful failure rate; it is controlled by process, review and test, not by arithmetic.
A note on parallelism. Our sketch treats the cell as if it stands alone, but most packs put cells or strings in parallel, and that changes the tree at two levels. Within a parallel group, every cell shares the same voltage, so one cell cannot over-voltage on its own. The risk is quieter: if a cell’s connection opens or its fusible link blows, the group carries on with less capacity, looks normal at rest, and reaches Vmax first on charge. In a group of dozens of cells that loss is close to invisible by voltage, so in a highly parallel pack it is probably the most likely route to B4. Per-cell fusing, the approach in Tesla’s cell-level fusing patent [9], protects against a shorted cell being fed by its neighbours, but it does nothing for the lost capacity. Only capacity or resistance estimation per group catches that.
With packs or strings in parallel, there is a cause our tree does not yet show. A cell that shorts in one string leaves fewer working cells in that string, while the parallel strings hold it at pack voltage, so every remaining cell in the faulted string is pushed above Vmax. We have added it to the sketch as B11 on the left-hand OR gate. A fuse, contactor and current sensor on each string, and matching string voltages before they are connected (see our busbar layout for parallel strings page), remove the path rather than relying on the detection branch to catch it. This is the order we would work in: design the cause out first, then detect what is left.
Minimal cut sets: the qualitative answer
A minimal cut set is a group of basic events which, if they all happen, cause the top event, and from which no event can be dropped without breaking that link [2]. Reducing the tree with Boolean algebra gives two families here:
- Order 2: any one of B1 to B4 or B11, with either B9 (common cause) or B10 (wrong threshold).
- Order 3: any one of B1 to B4 or B11, with any one of B5 to B7 (primary channel faults), with B8 (secondary comparator dead).
We can learn most of what matters before touching a number. The order-2 sets bypass the redundancy we paid for, so they are the first things to design out: separate sense paths for the two channels, an independent reference, a threshold that is verified at end-of-line rather than trusted from a calibration file. The order-3 sets tell us the redundant pair is doing its job, provided B8 cannot sit dead for months without anyone noticing.
Putting numbers on it
For independent events, an AND gate multiplies probabilities and an OR gate adds them, with the sum being the usual “rare event” approximation that holds when each probability is small [2][3]:
where Pi is the probability of input event i at the moment of demand and n is the number of inputs to the gate.
The word “independent” is doing a lot of work. The standard way to account for shared causes is the β-factor model described in IEC 61508-6 Annex D [6]: a fraction β of a channel’s failures is assumed to take out both channels together. exida, a functional safety consultancy, summarises the Annex D range as 0.5% to 5% for programmable electronics [7]. Let’s see what that does to our detection branch, using illustrative numbers only (our arithmetic, not product data):
- Probability the primary channel has failed when the overvoltage arrives: QP = 1 × 10⁻⁴
- Probability the secondary comparator has failed: QS = 1 × 10⁻⁴
- Independent pair: QP × QS = 1 × 10⁻⁸
- Common cause with β = 2%: β × QP = 2 × 10⁻⁶
The common-cause term is 200 times larger than the redundant pair it is supposed to sit behind. That is the quantitative version of what the cut sets already told us, and it is why the dual-core lockstep vs dual-MCU debate is really a debate about dependent failures.
Latent faults need one more step. For a fault that stays hidden until a periodic test finds it, a common approximation for its average probability of being present is half the failure rate times the test interval:
where λ is the failure rate (per hour) and τ is the interval between tests (hours). Taking an illustrative λ = 50 FIT (50 × 10-9 per hour) for the secondary comparator: if it is self-tested at every key-on, say every 2 hours of operation, QS ≈ 5 × 10⁻⁸. If it is never tested over an assumed 8,000 operating hours, QS ≈ 2 × 10⁻⁴, about four thousand times worse. Same part, same rate; the start-up check is what makes the AND gate real. This is the territory of the latent fault metric on our SPFM, LFM and PMHF page.
Where do real rates come from? For electronics, prediction handbooks and supplier FMEDA data. For cell- and pack-level events there is far less published data. A 2026 study from CEA built a full EV pack fire fault tree and, because most basic events had no published probabilities, asked a panel of around 150 battery experts to grade each one on a five-step likelihood scale that was then mapped to per-hour values [8]. Their elicited values for the pack in their use case put a contactor failure at 1.44 × 10⁻⁶ per hour and a BMS failure at 4.92 × 10⁻⁶ per hour [8]. The authors are clear that these are relative, use-case-specific numbers, not absolute failure frequencies, and we would treat them the same way. Their more useful result is structural: adding one more independent barrier (battery preconditioning against cold charging) cut their branch probability by five orders of magnitude [8].
FTA and FMEA side by side
| FMEA | FTA | |
|---|---|---|
| Direction | Bottom-up (inductive) | Top-down (deductive) |
| Starts from | Each part or function, and how it can fail | One undesired top event, usually a violated safety goal |
| Best at | Completeness: finding failure modes nobody thought of | Combinations: showing which failures must coincide, and where redundancy is bypassed |
| Main output | Ranked failure modes and actions (RPN or Action Priority) | Minimal cut sets and, if quantified, a top event probability |
| ISO 26262 role | Inductive analysis, expected at all ASILs | Deductive analysis, expected at ASIL C and D |
UL Solutions, which sells functional safety certification, summarises ISO 26262 as requiring inductive analysis at every ASIL and deductive analysis at ASIL C and D [5]. For a BMS with ASIL C or D voltage monitoring, that makes a fault tree per safety goal part of the expected evidence for the safety case. In practice the two feed each other: the basic events in the tree are failure modes from the FMEA, and a cut set that surprises the team usually sends someone back to add a row to the FMEA.
Common pitfall: drawing two voltage channels under an AND gate and multiplying their rates, while both channels share the same sense harness, connector and reference. The tree looks safe and the arithmetic looks impressive. The common cause belongs on the OR gate above the AND, as B9 does in our sketch.
From the tree to fault-injection tests
The question that matters for every AND gate is whether its inputs really are independent. Two channels can have separate measurement chips and still share a supply rail, a reference, a ground return, an isolated comms link or the microcontroller that acts on both. The same applies further along the chain: widen the top event to “uncontrolled overvoltage” and the shutdown path (contactor driver, its supply, the open command) joins the tree, and it can lean on exactly the same shared items. Each one deserves its own basic event on the OR gate above the AND. Once it is drawn, it can be tested.
| Shared dependency | What it does to the tree | Targeted fault-injection test |
|---|---|---|
| Supply rail feeding both channels | Both channels brown out or reset together | Drop the rail through its undervoltage threshold while a cell is held above Vmax; confirm the system still reaches a safe state |
| Voltage reference | Both channels read low by the same offset, so they agree with each other | Inject a reference offset; confirm a plausibility or cross-check against an independent measurement catches it |
| Sense harness or connector | Both channels see the same wrong voltage | Open a sense line or add series resistance; confirm the open-wire diagnostic flags it within the fault tolerant time interval |
| Daisy-chain or isolated comms | Stale values accepted as fresh | Freeze, drop or replay frames; confirm rolling counter, CRC and timeout checks reject them |
| Controller acting on both channels | Detection works but nothing reacts | Halt or hang the main MCU; confirm the secondary path can open the contactors without it |
This closes the loop between analysis and test. The cut set says which combination matters, the injected fault shows whether the safety mechanism really catches it, and the result becomes evidence in the safety case. A dependency that cannot be tested is a sign the architecture needs another look.
How we would approach it
- Take the top event word for word from the requirement the tree protects: the safety goal for a vehicle-level tree, or the technical safety requirement it was allocated for a subsystem tree such as the BMS. Agree it in writing before drawing anything.
- Build the tree qualitatively and extract the minimal cut sets. Fix any order-1 sets (single points of failure) and question every order-2 set.
- Add common-cause and systematic events explicitly on the OR gates. If they are not on the drawing, they are not in the analysis, and nobody will write a test for them.
- Quantify only once the structure is stable, and note where each basic event rate came from: supplier FMEDA, a prediction handbook, or judgement.
- Feed the latent faults and their test intervals into the safety mechanism design and the PMHF calculation.
Our view is that most of the value of a BMS fault tree comes from step 2. The minimal cut sets tell the hardware team where a second channel is genuinely independent and where it only looks independent, and that conversation is worth having long before anyone argues about whether a rate is 50 or 80 FIT. As BMS architectures move towards wireless cell monitoring and shared zonal controllers, the common-cause events on the OR gate are likely to become the hardest part of the tree to close.
Nigel: I have found fault trees to be really powerful. If the cell supplier and the OEM each build one and then compare them, it is a powerful way of finding failure modes you hadn’t thought of. The layout also lets you see the countermeasures visually: where you have several, and where you have none. Sometimes just thinking about the problem from a different perspective really helps, and that is exactly what using both FMEAs and FTAs gives you.
References
- IEC 61025:2006, Fault tree analysis (FTA), Edition 2.0. IEC Webstore
- Vesely, W.E., Goldberg, F.F., Roberts, N.H. and Haasl, D.F. (1981). Fault Tree Handbook, NUREG-0492. U.S. Nuclear Regulatory Commission. NRC
- Stamatelatos, M. et al. (2002). Fault Tree Handbook with Aerospace Applications, Version 1.1. NASA Office of Safety and Mission Assurance. NASA (PDF)
- ISO 26262-9:2018, Road vehicles, Functional safety, Part 9: ASIL-oriented and safety-oriented analyses. ISO
- UL Solutions. Functional Safety Analysis. UL Solutions
- IEC 61508-6:2010, Functional safety of E/E/PE safety-related systems, Part 6: Guidelines on the application of IEC 61508-2 and IEC 61508-3 (Annex D, common cause failures). IEC Webstore
- exida. The importance of considering common cause with redundant systems. exida blog
- Ditto, A., Dauchy, J., Vincent, R., Gevet, D., Payan, C., Bonnaud, C. and Weick, C. (2026). Fault Tree Analysis of Lithium-Ion Battery Pack Fire Risk for Electric Vehicle Applications. Batteries, 12(7), 252. doi:10.3390/batteries12070252
- Hermann, W.A., Kohn, S.I., Kreiner, P.B. and Gadda, C.D. (2012). Battery pack with cell-level fusing. US Patent 8,133,608 B2, assigned to Tesla Motors. Google Patents
See also: Failure Mode and Effects Analysis (FMEA) in Battery Design, Worked Example: BMS/System FMEA, BMS Hazard Analysis & Risk Assessment (HARA), BMS Hardware Architectural Metrics (SPFM, LFM, PMHF), Functional Safety Fundamentals & Standards, ISO 26262, Quality