
Do electric vehicles expose their occupants to electromagnetic fields? Yes, to low-frequency magnetic fields, and the published measurements put most readings below the public reference levels, with a few that need a closer look. This post sets out what the measurements show, then treats it as a design topic: the field comes from current loops in the high-voltage system, so pack, cable and inverter layout decide how big it is. The line here is no fear and no denial. It sits alongside our High Voltage System hub.
What is measured
The subject is low-frequency magnetic flux density, in microtesla (µT), from DC and switched currents in the traction system. Radio-frequency exposure from radios and radar is a separate topic outside the battery scope. The yardstick is the ICNIRP general-public reference levels, which vary with frequency. Many studies quote results as a percentage of those levels using a weighted-peak method, which adds the frequency components with a weighting for each [1][2].
What the measurements show
The SINTEF-led EM-Safety project measured eight electric vehicles and three conventional cars with a sensor-fitted mannequin at head, chest and feet [2]. The highest foot-level exposure was about 20% of the ICNIRP level for the electric vehicles, at start-up, against about 10% for the combustion cars. At head height it fell to about 2% [2]. Fields stayed below the reference level, and the electric vehicles were higher at the feet.
The European Commission’s Joint Research Centre measured nine electrified passenger cars in a laboratory [1]. The highest values were at the feet, during hard acceleration and regenerative braking [1]. The report lists readings above 100% of the reference level for some plug-in hybrids and one electric vehicle, and asks whether they reflect the cars or the instrument and method [1]. No specific legislation covers vehicle fields. The report calls for harmonised test procedures and names three existing ones: IEC TS 62764-1:2019, China’s GB/T 37130-2018 and a US national laboratory procedure [1]. Two labs can therefore reach different answers on the same car, so read any single percentage with that in mind.
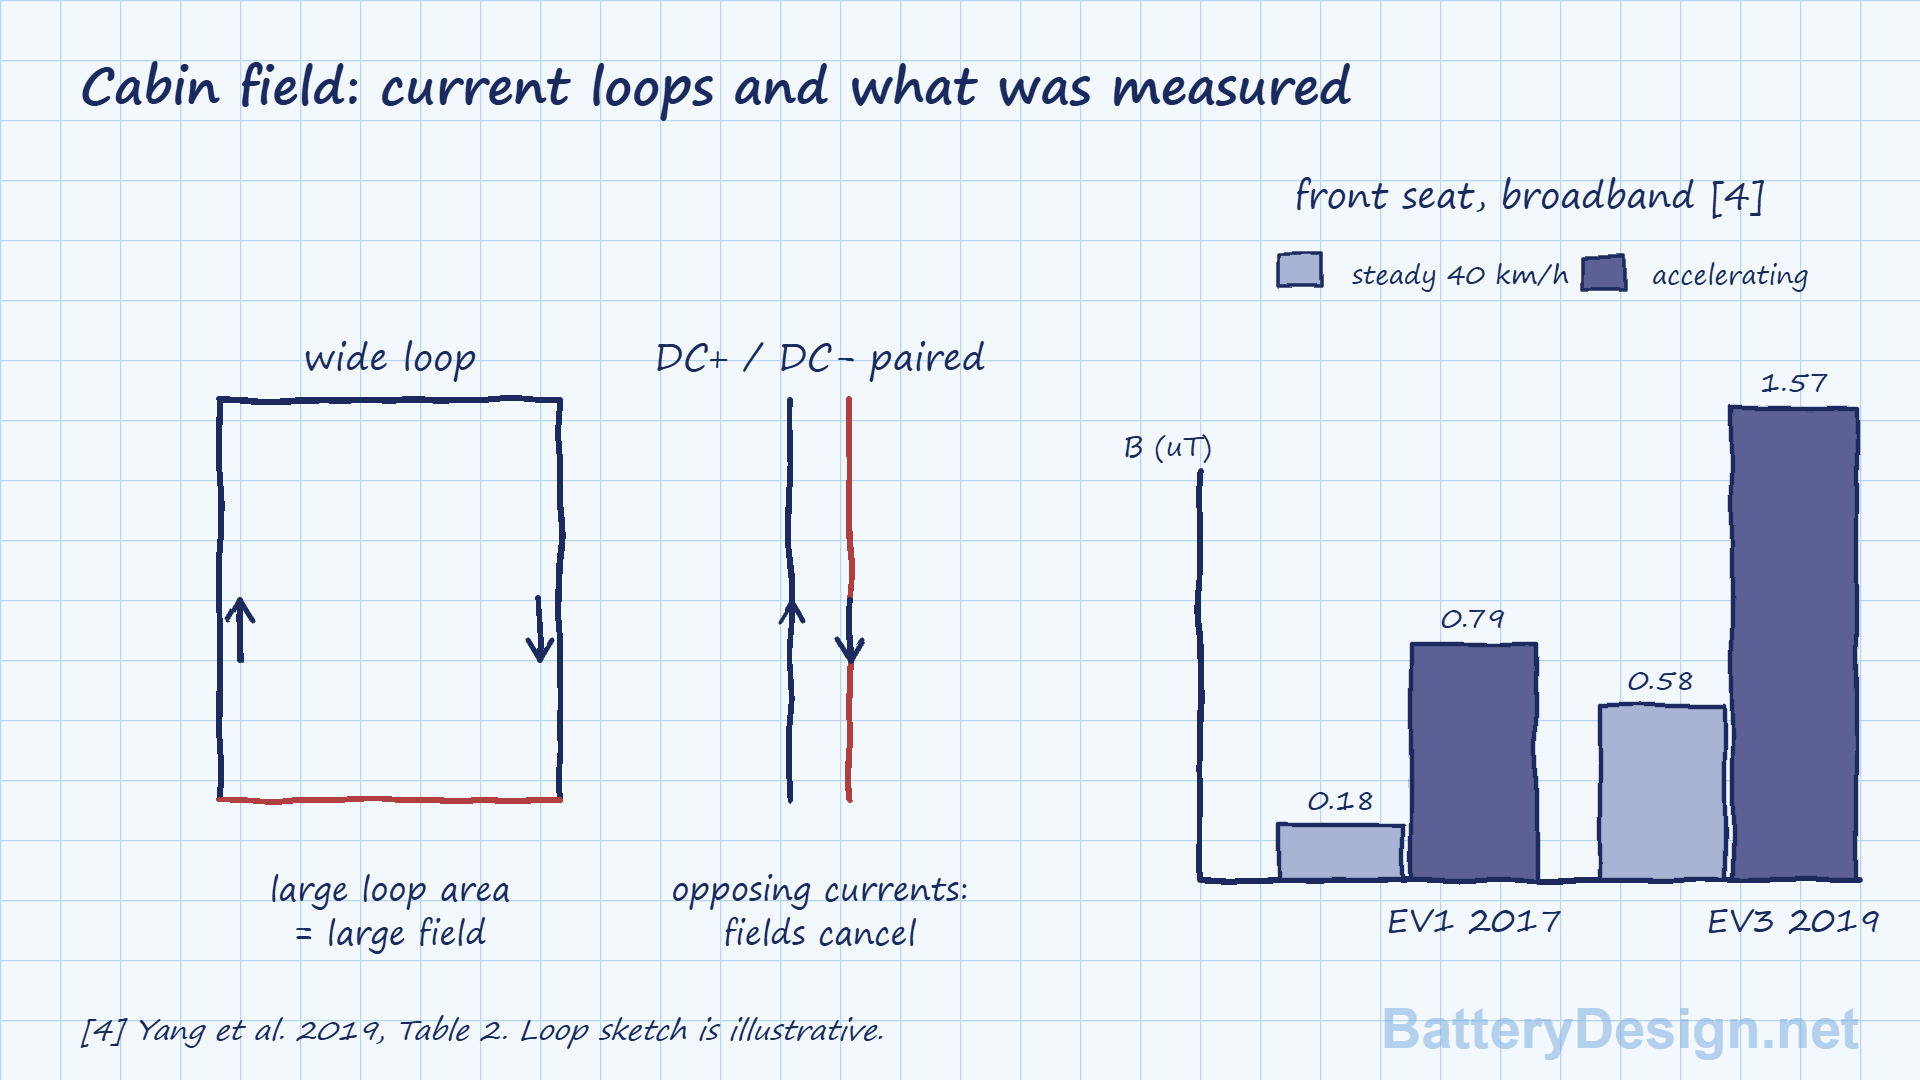
A Chinese team monitored three popular electric cars (a BYD Qin, a BYD Yuan and a Beijing Automotive EX360) over three summer sessions, with probes on the front and rear passenger seat cushions [4]. Broadband readings were roughly 0.7 to 1.6 µT under gentle acceleration (0 to 40 km/h) and 0.2 to 0.6 µT at a steady 40 km/h, so traction current drives the field [4]. The highest mean was 1.57 µT, in the EX360 front seat in 2019. Our arithmetic puts that under 1% of the 200 µT public level the paper quotes for 25 to 400 Hz. It is an order-of-magnitude guide, not a compliance figure, because the readings are unweighted and the reference levels change with frequency. Two of the three cars read higher over the years, which the authors link to repairs and replaced tyres and hubs (possibly magnetised tyre steel belts). Routine servicing made no difference [4]. The study covers three cars, one road and one acceleration, with no charging test and no conventional-car comparison.
An Israeli survey measured ten conventional and hybrid cars (three diesel, four petrol and three hybrid) at constant speed, with broadband 40 to 800 Hz meters worn at each seat [5]. Averaged over all seats the geometric mean was 0.018 µT for diesel, 0.041 µT for petrol and 0.050 µT for hybrids. Hybrids were the most variable: 16% of their readings were at or above 0.2 µT, against under 0.3% for the other two, and in the back right seat at 80 km/h the geometric mean reached 0.286 µT, with 69% of readings at or above 0.2 µT [5]. The authors link the hybrid rear-seat peak to battery and cable position, which they presume and did not test [5]. These are broadband microtesla readings, not percentages of the ICNIRP level, so they cannot be read directly against the figures above. The sample is small and contains no battery EVs, so we use it as supporting evidence on layout and speed, not as an EV result.
A 2026 narrative review collected ten in-cabin measurement studies on pure battery EVs from Korea, Italy, China, Romania, Poland, Japan and India [6]. Converted to microtesla, most reported levels sit between 0.01 and 5 µT, with a maximum of about 60 µT [6]. That maximum is one car in the Italian chamber study, at the front left foot during acceleration; for that car the study reported a weighted peak index of up to 77% of the reference level, against up to 16.9% for the other car tested [6]. Across the studies the highest fields were at or near the floor and footwell, several found rear-seat levels similar to or above the front, and fields generally rose with speed and acceleration [6]. The reviewers link the rear-seat result to the pack sitting under the rear floor. Only one of the ten studies states that it followed IEC 62764-1:2022, the measurement standard that defines stationary, constant-speed, dynamic and charging test modes, so the results differ in method and cannot simply be pooled [6]. This is a narrative review of Google Scholar results without formal quality scoring, and we have not checked the individual studies.
Charging is a separate case
A JRC study of five DC fast chargers recorded localised peaks above 100 µT at 50 Hz in three of the five chargers at very close range during charging [3]. At 20 cm and beyond, the exposure indices were below 50% of the reference level [3]. The worst-case probe distance of 7.5 cm is close to contact, and the authors say it does not represent a whole-body average. The sample was small and covered early charger models. For the higher powers now arriving, see Megawatt Charging.
On health, a 2026 cardiology review collected five clinical studies on cardiac implants and EVs [7]. In one, 108 patients with pacemakers or defibrillators were tested around four EV models during operation and charging; the highest fields, during charging, were 30.1 to 116.5 µT and no interference was detected. In another, 130 patients were followed through 561 high-power charging sessions at up to 350 kW, with a very low interference risk (0% to 2% on a patient basis, 95% confidence interval) [7]. The reviewers conclude there is no sign of an immediate cardiovascular risk, but that long-term effects are uncertain and that the exposure guidelines do not specifically address implants [7]. We read the review and not the underlying studies, so treat these figures as second-hand.
A Japanese team measured three current models, an EV, a PHEV and a petrol car, on a test track following IEC 62764-1:2022 [8][9]. The standard covers 1 Hz to 100 kHz and defines stationary, constant-speed, dynamic and plug-in charging modes [9]. The highest RMS reading in the EV was 4.67 µT at the rear seat during acceleration, measured 6.5 cm from the seat surface. The PHEV reached 20.2 µT at the rear seat during deceleration, and the petrol car’s highest was 8.78 µT at the dashboard while stationary, which the authors link to the wiper motor [8]. The EV and PHEV rear-seat peaks were at very low frequency (4 Hz and 1 Hz), near the wiring that links the front and rear batteries around the rear footwell, and the authors presume current in that wiring is the source [8]. Summed across frequencies against the ICNIRP 2010 reference levels, the ratio was at most 0.04 for the EV and 0.06 for the PHEV at any position [8]. In charging, the EV read 0.54 µT at the cable and 0.58 µT at the socket during standard AC charging, with a 50 Hz peak; DC quick charging was no different from the 0.31 µT background, although the meter does not measure static fields [8].
Three limits apply. There was one car of each type, readings are 1 s RMS values, and the standard leaves out transients shorter than 200 ms. An earlier Austrian laboratory report, which did include transients, quoted much higher peaks, including 768 µT for a PHEV in maximum acceleration [8]. IEC 62764-1:2022 replaces the 2019 technical specification [9], and we read it as a preview extract only (scope, definitions and measurement conditions).
Where the field comes from and how layout cuts it
This section is our engineering reasoning from first principles, not a result from the studies above. The magnetic field around a conductor scales with current. Two conductors carrying equal and opposite current, run close together, largely cancel each other’s field at a distance. The large loops are therefore the problem. In a traction system the main sources are the pack busbars, the HV cables between pack and inverter, the inverter’s switching harmonics and the motor. Four layout habits follow:
- Keep the loop area of each current path small, so out and return currents run side by side.
- Route DC+ and DC- together, twisted or bundled, between pack and inverter.
- Use symmetric or laminated busbars, and arrange cells so currents in neighbouring paths oppose. See Busbar Layout for Parallel Strings.
- Keep the highest-current routes away from the occupants’ feet and the rear seat, where the measurements put the peaks.
Shielding is a trade-off. A conductive screen helps against switching fields, but low-frequency magnetic fields need a magnetic material or a closed return path, which adds mass and cost, so try loop area first. The EMC Directive 2014/30/EU covers interference to other equipment, not occupant exposure. Our HV Definitions and Glossary explains the HV terms used here.
What to take from this
Most published readings sit below the public reference levels. Fields are higher at the feet than in combustion cars, a few unexplained readings in plug-in hybrids and one EV exceed the reference level, and the test methods are not harmonised. For the design engineer the useful answer is simple: small loop areas and paired conductors reduce the field at almost no cost.
References
- Trentadue, G., Zanni, M. and Martini, G., Assessment of low frequency magnetic fields in electrified vehicles, EUR 30198 EN, Publications Office of the European Union (2020), doi 10.2760/056116
- SINTEF, EM-Safety project: Measurement of the magnetic field inside electric vehicles, project results page (the work reported by Vassilev et al., IEEE Trans. EMC 57, 35-43, 2015)
- Trentadue, G. et al., Assessment of low-frequency magnetic fields emitted by DC fast charging columns, Bioelectromagnetics 41, 308-317 (2020)
- Yang, L., Lu, M., Lin, J., Li, C., Zhang, C., Lai, Z. and Wu, T., Long-Term Monitoring of Extremely Low Frequency Magnetic Fields in Electric Vehicles, International Journal of Environmental Research and Public Health 16(19), 3765 (2019)
- Hareuveny, R., Sudan, M., Halgamuge, M.N., Yaffe, Y., Tzabari, Y., Namir, D. and Kheifets, L., Characterization of Extremely Low Frequency Magnetic Fields from Diesel, Gasoline and Hybrid Cars under Controlled Conditions, Int. J. Environ. Res. Public Health 12(2), 1651-1666 (2015)
- Tsai, P.-H. and Chen, X., From Measurement to Health: A Synthesis of EMF Exposure, Biological Evidence, and Safety Guidelines in Electric Vehicles, Int. J. Environ. Res. Public Health 23(10), 1242 (2026)
- Dewi, I.P., Anggitama, A.M., Yusrizal, T. and Dewi, K.P., High Voltage, High Stakes: Assessing Cardiovascular Effects of Electromagnetic Fields From Electric Vehicles, JACC: Asia 6(8), 1692-1699 (2026)
- Fukui, H., Minami, N., Tanezaki, M., Muroya, S. and Ohkubo, C., Magnetic Field Measurement of Various Types of Vehicles, Including Electric Vehicles, Electronics 14(15), 2936 (2025)
- IEC 62764-1:2022, Measurement procedures of magnetic field levels generated by electronic and electrical equipment in the automotive environment with respect to human exposure, Part 1: Low-frequency magnetic fields (preview extract read)
See also: High Voltage System, Busbar Layout for Parallel Strings, 2014/30/EU (EMC Directive), HV Definitions and Glossary, Megawatt Charging, Inverters, 800V Architecture
Get the next teardown in your inbox
New teardowns, benchmarks and design data from BatteryDesign.net, free by email. Unsubscribe any time.